The impact on variation of spend was found to lie not simply in individual factors, but in combinations of the factors
A detailed scrutiny of national data was undertaken to identify the factors operating in the wider economic and political environment that influence the level of spend on children’s services.
It should be noted that as this exercise is concerned with correlation analysis of the data relating to each council, it is not possible to draw a cause-and-effect relationship between the five factors and spend. Neither does it provide a hard-and-fast rule as to what a council should spend. Across the country, there are authorities with high levels of deprivation, highly-rated outcomes from their services and low levels of spend, just as there are those with low levels of deprivation, poor outcomes and high spend.
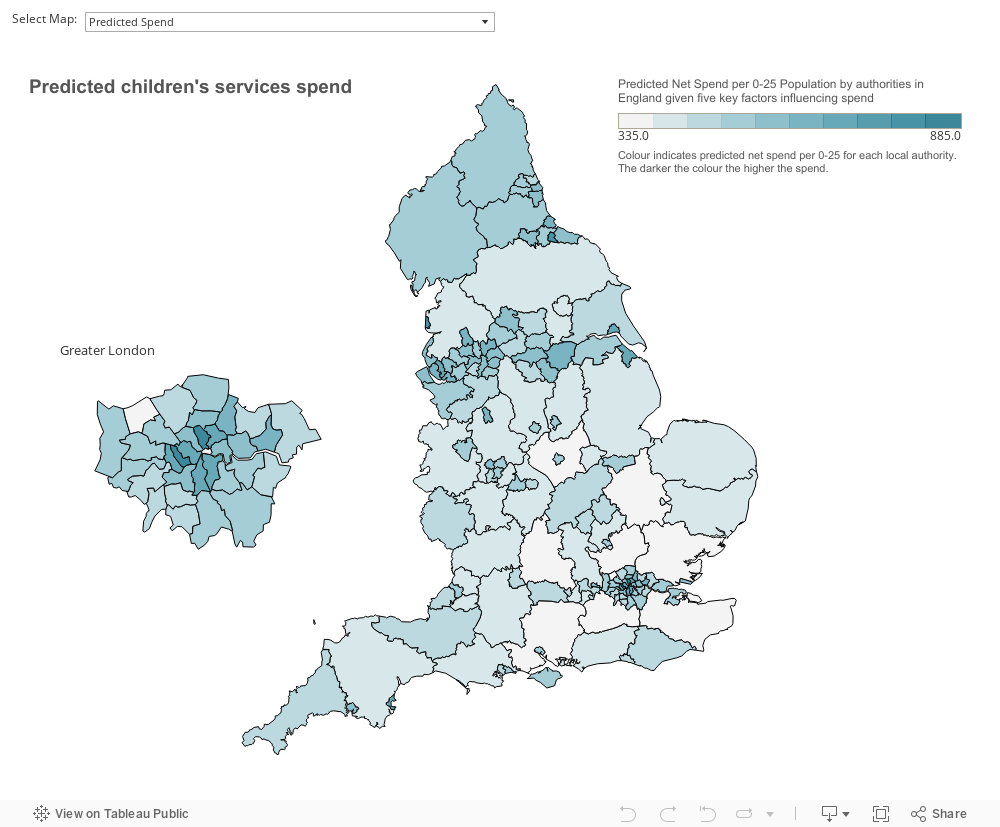
However, the following heatmaps may be a helpful tool to understand where local authorities benchmark according to those five factors that were found to have the greatest impact on variation.
These are:
- Deprivation – Higher levels of deprivation are linked to higher spend
- Size of population aged 0-25 – Larger 0-25 populations are linked to lower spend
- Disposable household income – Higher disposable income is linked to higher spend
- Levels of unemployment – Higher unemployment is linked to higher spend
- Levels of crime – Higher levels of crime are linked to higher spend
We have also used this data to predict what an authority’s spend might be. There may be a difference between this and an authority’s actual spend – which we found could be driven by two things:
- How an authority completes its financial reporting – we found this could create variation up to 12%.
- Studying spend on looked after children and safeguarding children showed 13% of spend variation comes from differences in practice and processes within control of councils. The changes required to achieve this consistently, whilst more in the control of councils than other local partners, are nonetheless complex, potentially costly and challenging to achieve, with no ‘one size fits all’ solution across authorities.
- The way an authority funds and runs it services which includes local factors, the impact of partners, as well the use of early help and preventative services – our findings showed spend on these areas varied significantly, from 22% of total children’s budget in one authority to 56% in another.
The report features further detail on these factors, the role they play in driving variation in spend and what an authority might want to consider when looking at their own spend.
Contains public sector information licensed under the Open Government Licence v3.0.